Precision Horticulture
Our Precision Horticulture services are designed to help growers achieve their optimum crop load sooner, more easily, and at lower cost.

What is precision Horticulture?
A data-driven approach to crop management that is enabled by innovative and precise technologies, allowing optimisation at a much greater level of specificity, like individual trees or bays rather than uniformly across a block or management area. The problem that precision horticulture seeks to solve is variability – orchards are not uniform and treating them as if they are leaves productivity and ultimately profitability on the table.
Variability is inherent in every orchard block – it comes with the territory. Trees die and replants take their place, soil patterns provide varying levels of nutrition and water, crop loading decisions can lead to vegetative vigour or check the growth of trees. Even from planting, variability in nursery stock means a block is at no stage perfectly uniform. In practice, this means differences in bud numbers, bloom density, fruit weight, and canopy size. Often managing a block with a single strategy means we exacerbate variability – over applying inputs to productive areas and failing to address those where the need is greater.
Orchardists have always known that variability is present, but precision horticulture now gives them the tools to accurately identify, map and subsequently treat that variability; cost effectively and at scale.
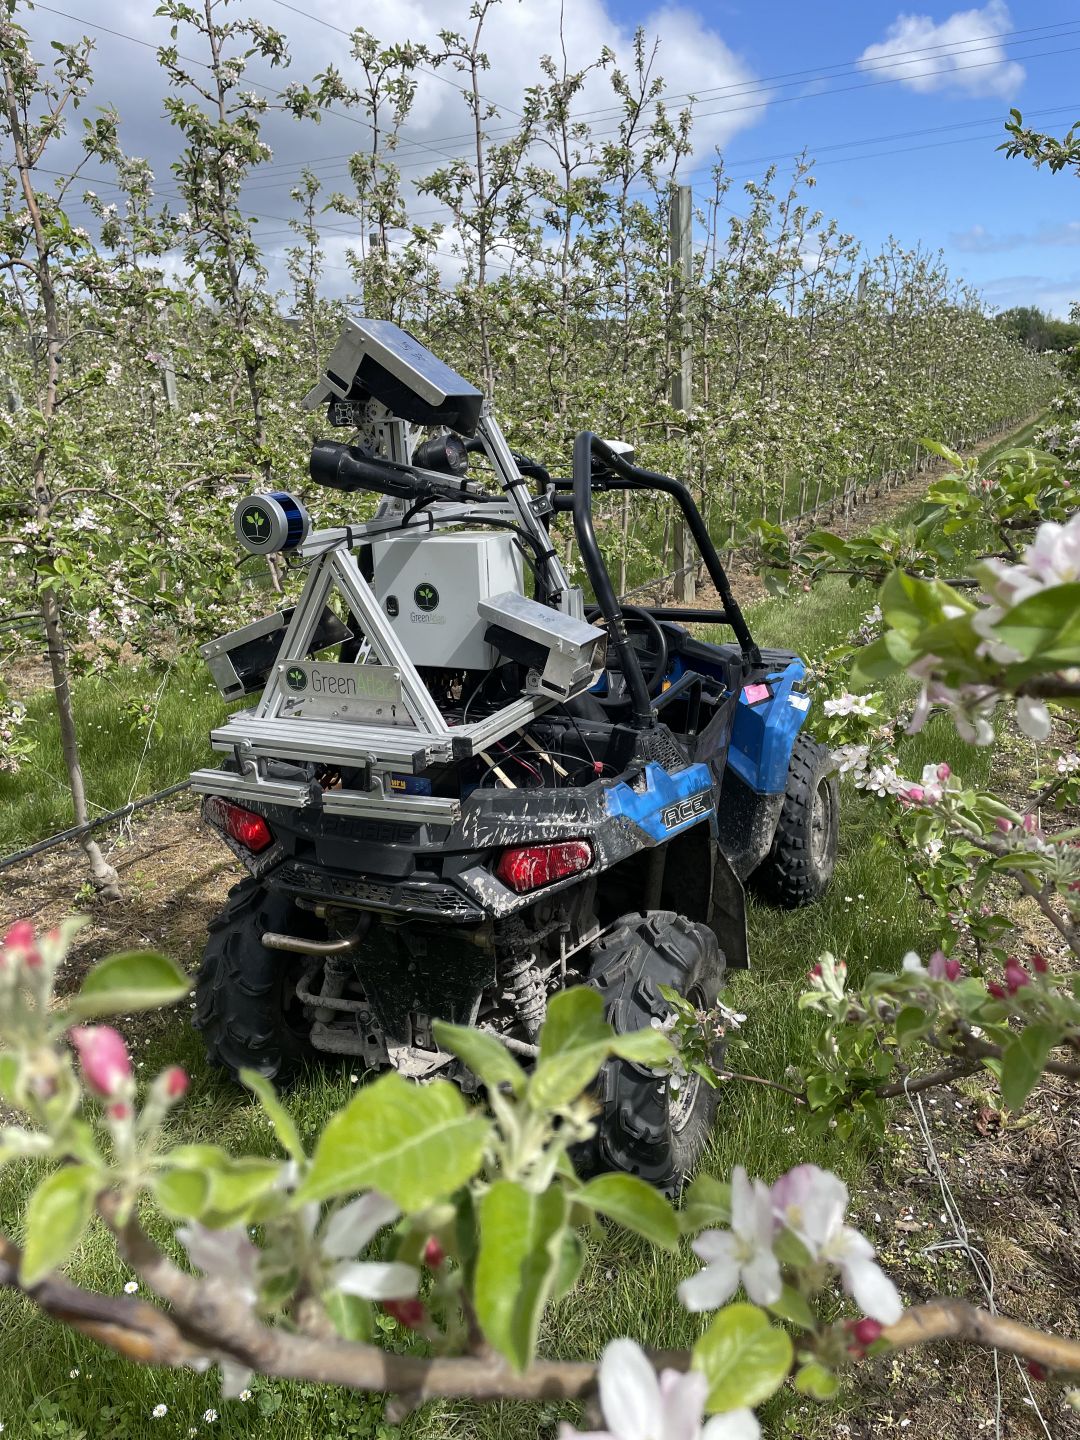
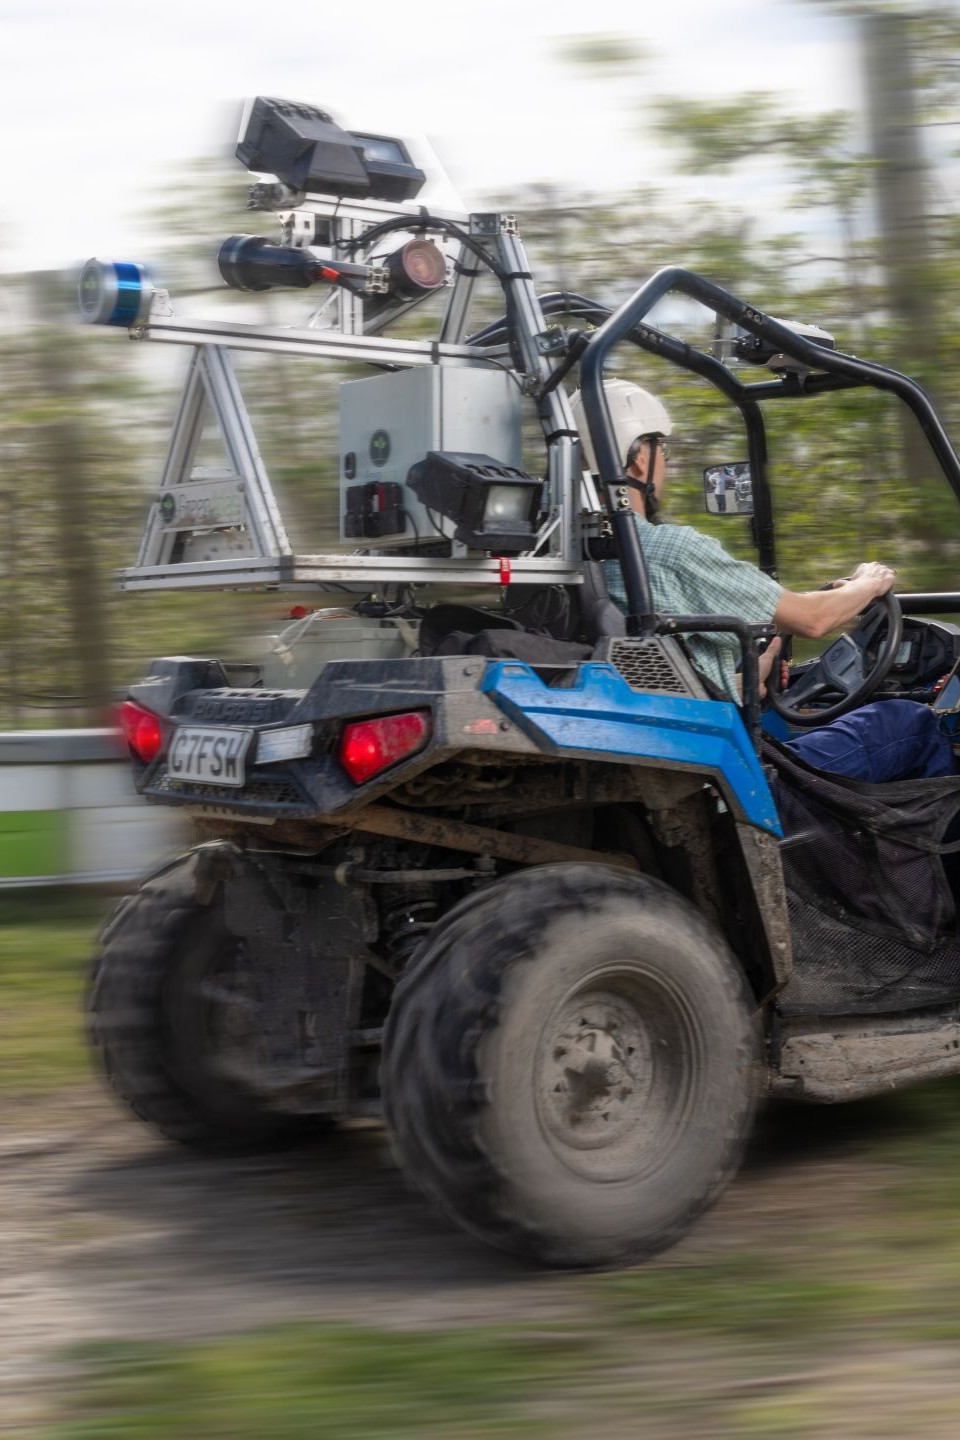
Green Atlas Scanning
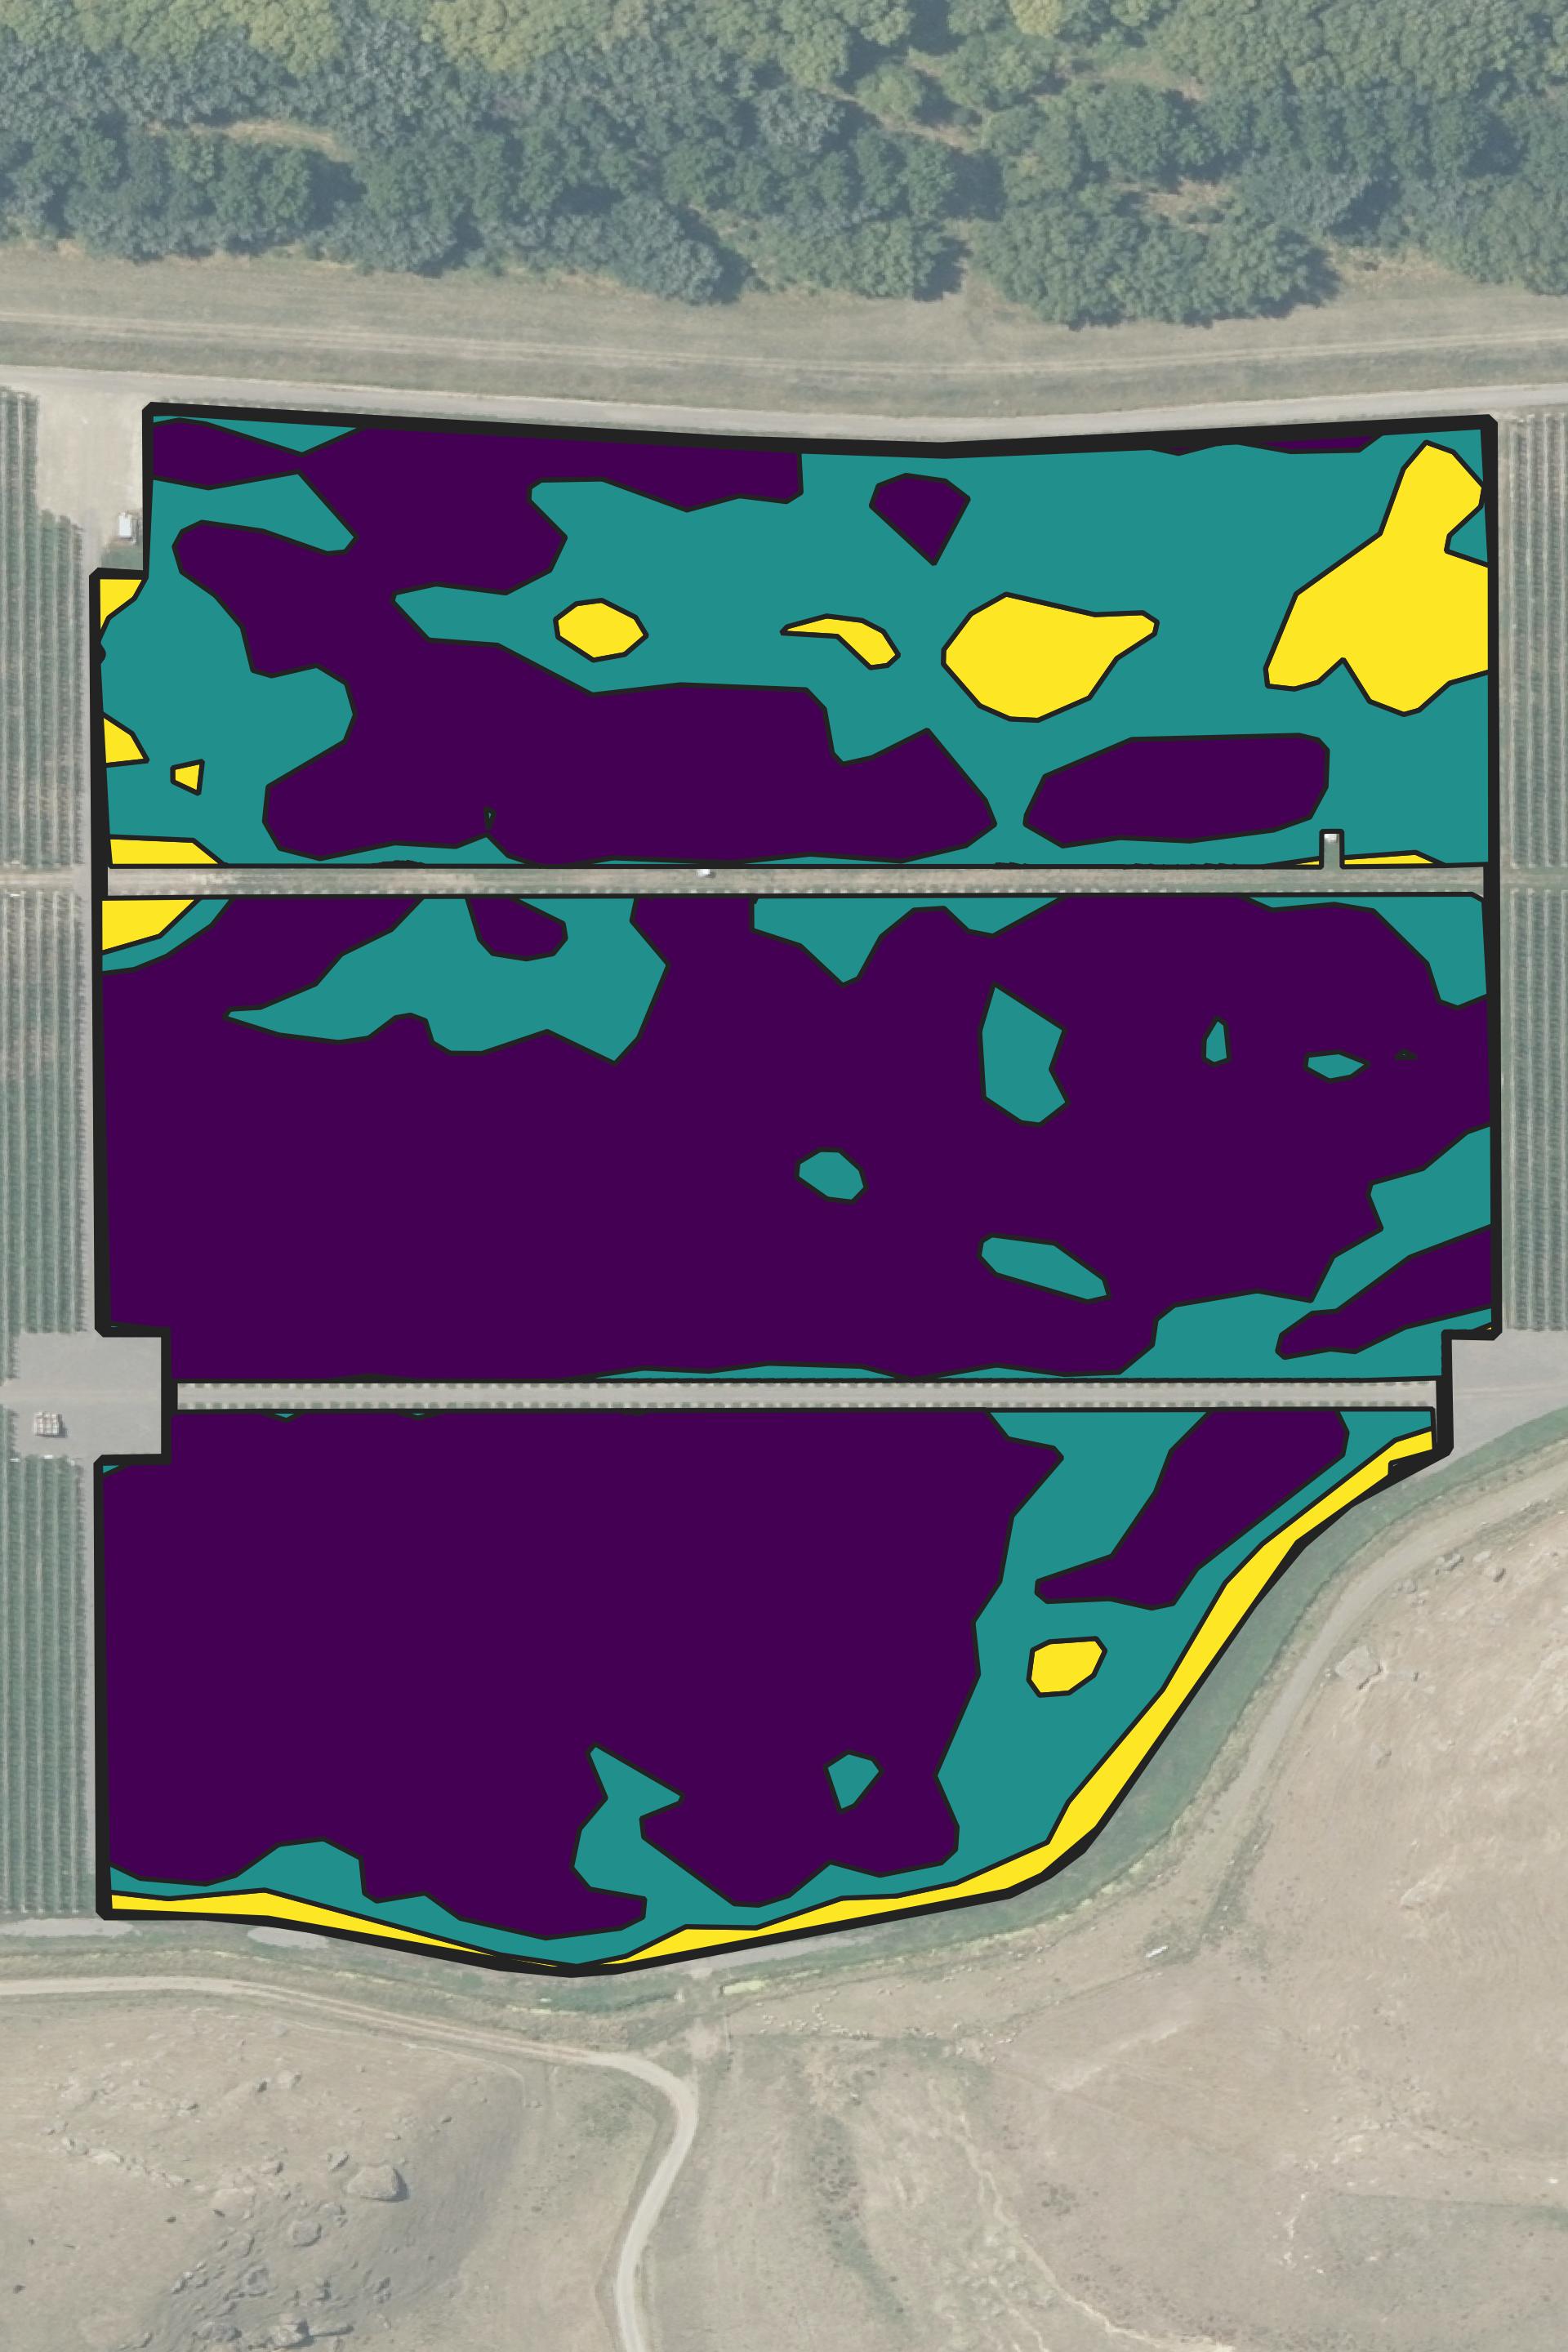
The Green Atlas Cartographer accurately detects and efficiently maps the density of buds, flowers and fruit in apple, kiwifruit and other fruit crops. LiDAR scanning simultaneously maps leaf area, height and canopy density.
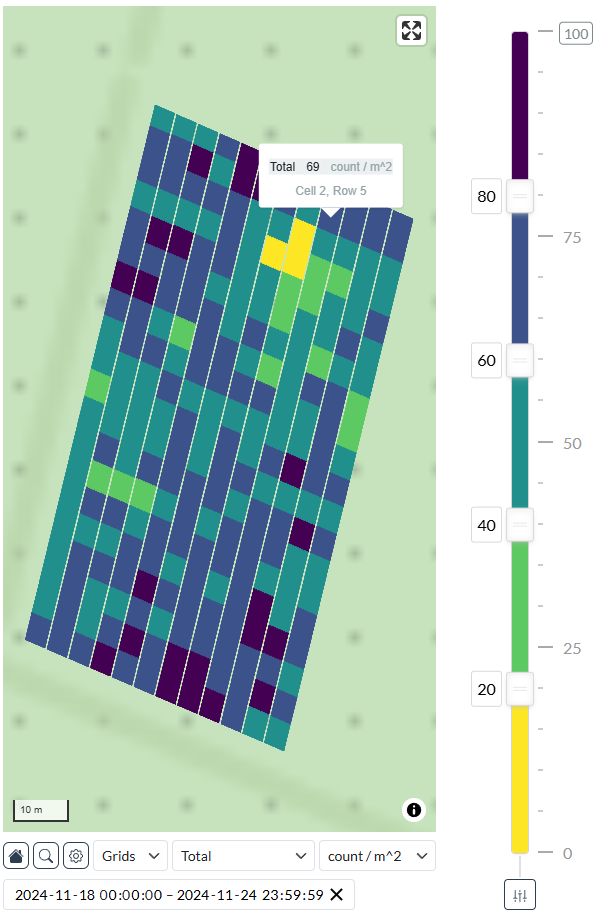
Our crop scanning results are delivered as detailed orchard heatmaps and clear statistics to help you understand the variation in your block. We also generate geo-referenced orchard maps which can be used on a phone or tablet to navigate to areas of interest in the scan.
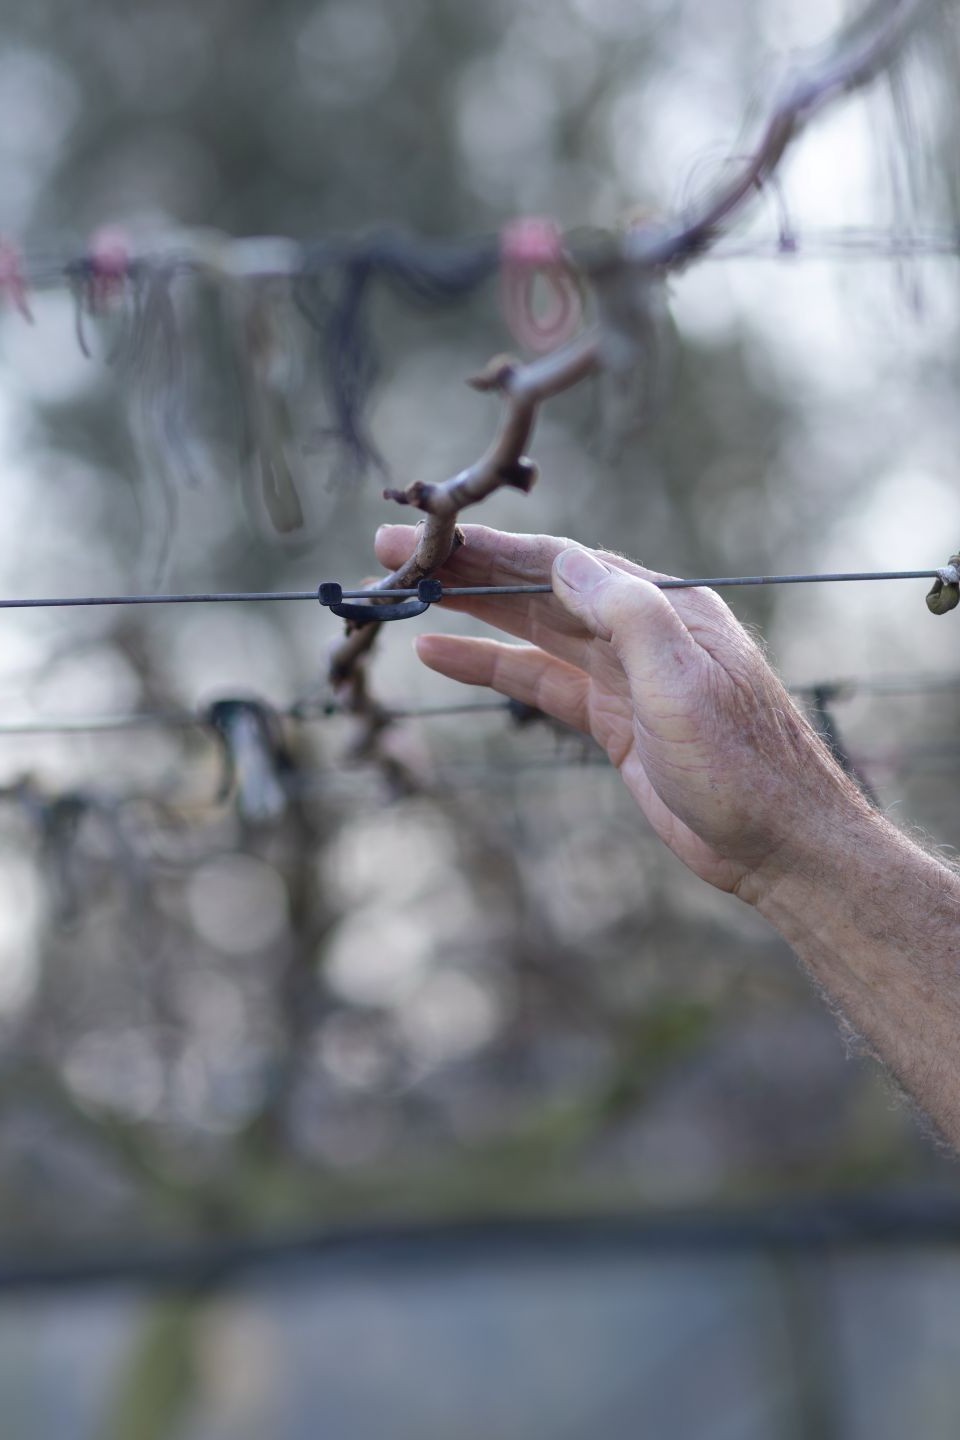
Bud scans quantify fruiting sites which indicates whether winter pruning has been effective. Confirming correct bud numbers in winter helps to prevent unnecessary thinning costs later in the season.
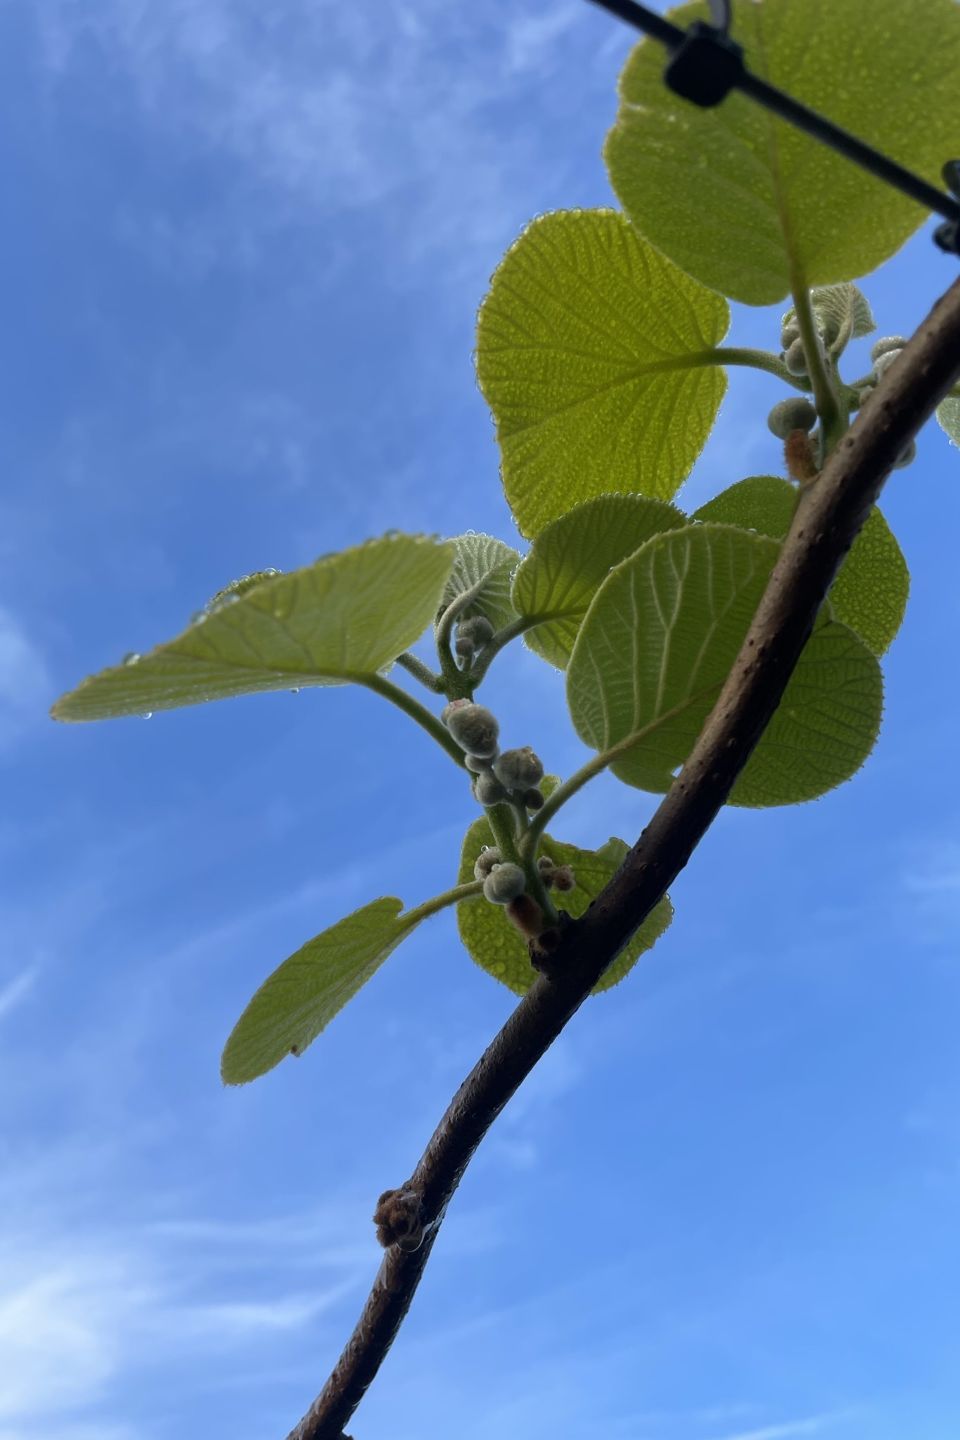
Flower and fruitlet scans help you make the best crop management decisions – identifying problem areas, ranking job priority and enabling you to develop thinning strategies to achieve your targets with uniformity across the block.
These flower and fruitlet scans also provide useful information for canopy management, helping to deliver high fruit colour and quality. These canopy maps can also inform adjustments to spray volumes for more targeted, canopy based applications that achieve better coverage and more effective chemical use.
Fruit scans help you make any late adjustments to crop load and collect further canopy information which can inform vigour control in the following season. These scans also provide accurate fruit numbers and fruit size for crop estimates.
Our Green Atlas crop scanning services are available across Hawkes Bay, Bay of Plenty and Gisborne, and we are always open to opportunities to expand into other regions across New Zealand.
Click here to download our kiwifruit and apple scanning brochures.
Green Atlas Interactive Viewer
All crop scan results are made available through the Green Atlas Viewer on the Fruition Portal as well as in pdf form for easy printing and sharing. The Green Atlas Viewer was developed to allow you to interact fully with orchard maps, letting you find out what to know about each of your blocks in more detail than the pdf report alone.
Features include:
- Adjustable scales to highlight low and high cropping areas with precision
- Customisable colour schemes to match your visual preferences
- Full orchard overview with all blocks in a single, easy to compare view
- Zoom functionality to focus in specific areas of interest
- Hover to reveal each individual image and data point collected
Check out the video here for a demonstration of Green Atlas Viewer functionality.
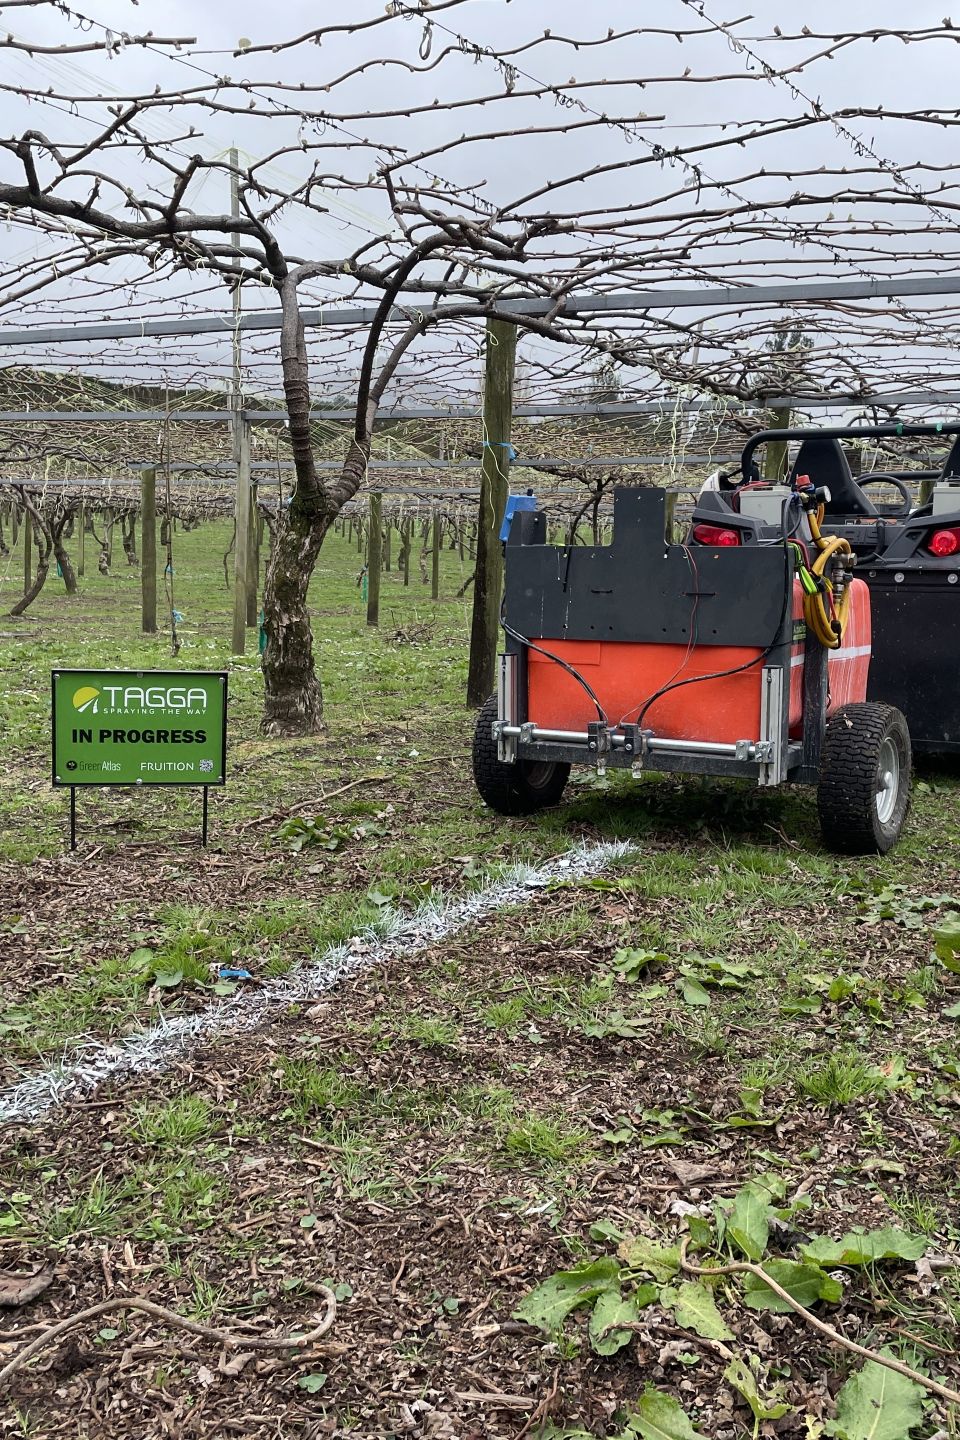
Tagga
Turning scan insights in to targeted action.
Tagga bridges the gap between crop scan results and efficient labour management. Scans measure crop variation in the orchard but the challenge for the most variable blocks is how to make that data more practically useful. Tagga does that.
Using your selected crop load target, Tagga marks your orchard per tree or per bay, showing exactly where attention is needed. Instructions to staff are simple: Act where there’s a mark. Walk past where there isn’t. Using your selected threshold, Tagga marks your orchard per tree or per bay, showing exactly where attention is needed. Instructions to staff are simple: Act where there’s a mark. Walk past where there isn’t.
This precision approach helps reduce over-thinning, improve crop consistency, and save on labour by focusing only on the areas that matter.
To better understand the opportunity Tagga presents, download the trial report here.
“I typically average around 280 hours per hectare thinning across all stages. With Tagga this has come down to 180 hours. We still cover every bay for quality, but only perform crop loading in the marked bays.”
Prescription Maps
Green Atlas scan data can be used to generate prescription maps for a range of variable rate applications allowing inputs to be tied to either crop load or tree/vine requirement. Variable rate opportunities include:
- Targeted spraying of thinning chemistry or other plant growth regulators (PGRs) to meet the specific
- Spreading compost or granular fertiliser based on crop load to replace crop removal.
- Root pruning or other trimming based on tree size or vigour to control growth and encourage uniformity.
Cartographer data is captured with a high level of spatial accuracy allowing accurate and precise actions to be taken with ease. Scan data is transformed easily into different formats meaning whatever kit you use, our maps will slot straight in.
The true value of using prescription maps and variable rate technology lies in improving the quality of your crop and the uniformity of your orchard. Reducing wastage is simply an added benefit.
Crop Optimisation
Crop Optimisation aims to help you maximise orchard profitability by identifying the optimal combination of management inputs for your specific variety and orchard system.
Traditional crop load targets expressed as fruit per tree don’t account for differences in tree size meaning each block requires a different target, complicating management. Our approach, Crop Optimisation (CropOpt), focuses on a tree’s capacity to carry crop, allowing us to think in terms of effective crop load.
Our latest work uses Tree Row Volume (TRV) – measured in cubic metres of canopy per tree – to assess fruiting capacity. By shifting the denominator in the crop load equation to fruit per m³, we create a more robust and scalable metric. This allows optimisation across varying tree sizes and orchard systems.
We take this further by analysing the combination of inputs required to achieve a given crop load and evaluating the resulting fruit value. This enables us to determine true profitability, not just yield. In many cases, the management required to produce the highest fruit value may be more costly and not deliver the best overall return.
CropOpt helps you find the sweet spot – where input decisions align with fruit value to deliver the most profitable outcome.
What our clients achieve
Fruition’s Precision Horticulture services have driven a range of positive outcomes for our clients:
- Reduced thinning costs through more targeted deployment of labour.
- Improved fruit quality and storage outcomes through optimal crop loading.
- Contractor accountability – verifying the quality and accuracy of work completed.
- Investor visibility and reporting – independent, accurate and easily interpreted.
- Optimised harvest, transport and packing logistics based on complete block coverage.
- Better nutrient and input decisions based on removal and relative need.
“Thanks for the efficient and prompt service. Great to have a digital count to adjust accordingly where needed.”
Got any questions?